London is both the UK capital and the capital of car crime.
Between June 2021 to June 2022 there were a reported 32,294 vehicle thefts recorded in London. This represents a 16% rise compared with the previous 12 months.
In the period June 2021-22 there were 277.55 thefts or unauthorised takings of a motor vehicle per 100,000 people in London – 50% more than the next area on the list, Greater Manchester. This equates to 68 vehicles per day over the course of a year.
In 2020/21 London had the highest rate of ‘interference with a motor vehicle’ in the country, with 151.06 offences recorded per 100,000 people. Bedfordshire came in second with a rate of 144.51 per 100,000 people, while South Yorkshire followed in third place with a rate of 134.83 per 100,000.
London also tops the list for the highest number of thefts of belongings from a vehicle. In 2020/21 there were 687.51 offences per 100,000 people.
London saw a total of 6,839 van theft incidents in 2020 and 2021. This is almost half (46%) of the offences seen across the UK.
Data specific to London is hard to come by but across the UK this is the top ten list of the most stolen cars in the UK
- 10, Mercedes E-Class
- 9. Vauxhall Astra
- 8. Vauxhall Corsa
- 7. Land Rover Discovery
- 6. BMW 3 Series
- 5. Mercedes C-Class
- 4. Volkswagen Golf
- 3. Ford Focus
- 2. Range Rover
- 1. Ford Fiesta
Rather specifically the Metropolitan Police recorded 7376 thefts of Land Rovers in London between the beginning of 2019 and the end of January 2022 which equates to an average of over 2000 stolen Land Rovers in the capital every year although it’s worth noting that there are some questions around how this data is logged
The QuoteSearcher review uses publicly available data to illustrate :
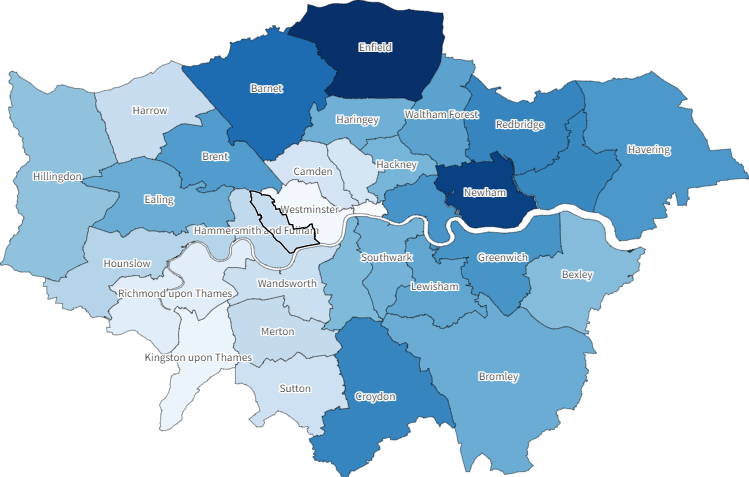
Where vehicle theft in London occur?
The cost of car crime in London
Convictions and arrests for vehicle crime in London
How many stolen vehicles are recovered?
Which car models are being stolen in London?
London vehicle crime compared to rest of UK
Types of vehicle theft and crime
Information Source: Read More
Energy Monitors | Electric Power | Natural Gas | Oil | Climate | Renewable | Wind | Transition | LPG | Solar | Electric | Biomass | Sustainability | Oil Price | Electric Vehicles|Commodities | Shipping|
Follow us: @OilAndGasPress on Twitter |