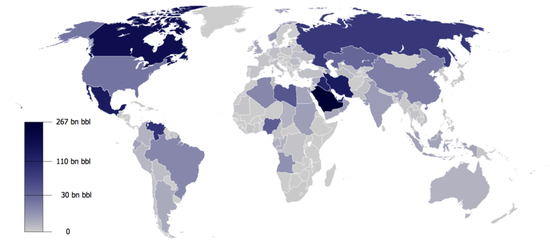
Amount of oil reserves in top 20 countries, represented in barrels
Some statistics on this page are disputed and controversial. Different sources (OPEC, CIA World Factbook, oil companies) give different figures. Some of the differences reflect different types of oil included. Different estimates may or may not include oil shale, mined oil sands or natural gas liquids.
| Country | US EIA [6] | OPEC [7] | BP [8] | Others | Production[5] (million bbl/year) | Years of production in reserve |
|---|---|---|---|---|---|---|
| 302,809 | 302,809 | 300,900 | 831.1 | 364 | ||
| 267,026 | 266,260 | 266,000 | 3,818.1 | 70 | ||
| 167,896 | 4,421 | 172,200 | [9] 171,000 | 1,336.8 | 126 | |
| 155,600 | [10] 208,600 | 155,600 | 1,452.9 | 107 | ||
| 145,019 | 147,223 | 143,100 | 1,624.8 | 89 | ||
| 104,000 | 104,000 | 104,000 | 1,067.2 | 97 | ||
| 98,630 | 98,630 | 98,630 | 1,133.7 | 87 | ||
| 80,000 | 80,000 | 102,400 | 3,851.3 | 21 | ||
| 48,363 | 74,363 | 78,400 | 366.1 | 132 | ||
| 47,053 | 32,773 | 55,000 | [11] 43,629 | 3,239.7 | 15 | |
| 36,972 | 37,453 | 37,100 | 730.0 | 51 | ||
| 30,000 | 30,000 | 30,000 | 582.2 | 52 | ||
| 25,620 | 25,627 | 18,500 | 1,452.9 | 18 | ||
| 25,244 | 25,244 | 25,244 | 555.9 | 45 | ||
| 12,999 | 12,634 | 13,000 | [11] 16,848 | 918.1 | 14 | |
| 12,200 | 12,200 | 12,200 | 492.1 | 25 | ||
| 8,273 | 8,384 | 12,700 | 645.9 | 13 | ||
| 8,273 | 8,273 | 8,000 | 200.2 | 41 | ||
| 7,300 | 6,537 | 10,800 | [12] 9.700 | 798.2 | 9 | |
| 7,000 | 7,000 | 7,000 | 304.2 | 23 |
Information Source: Read More
Oil and gas, press , | Energy, Climate, Renewable, Wind, Biomass, Sustainability, Oil Price, LPG, Solar